

Instructor-led training cost per learner is the total relevant cost of delivering an ILT session divided by the number of learners used for the calculation. The important choice is the denominator: registered learners, actual attendees and successful completers can produce very different numbers. A useful calculator shows planned and actual cost separately and explains which cost categories are included.
What should you decide before calculating cost per learner?
Choose the reporting unit first: one instructor-led session, a cohort, or an entire training program. Next, decide which costs count and whether the denominator means registered learners, confirmed attendees, or verified completers. For budget approval, compare forecast cost with expected attendance; after delivery, use actual expenses and attendance. Keep both measures, but do not label a projected price as an actual result. Name the finance or L&D owner responsible for approving the cost categories.
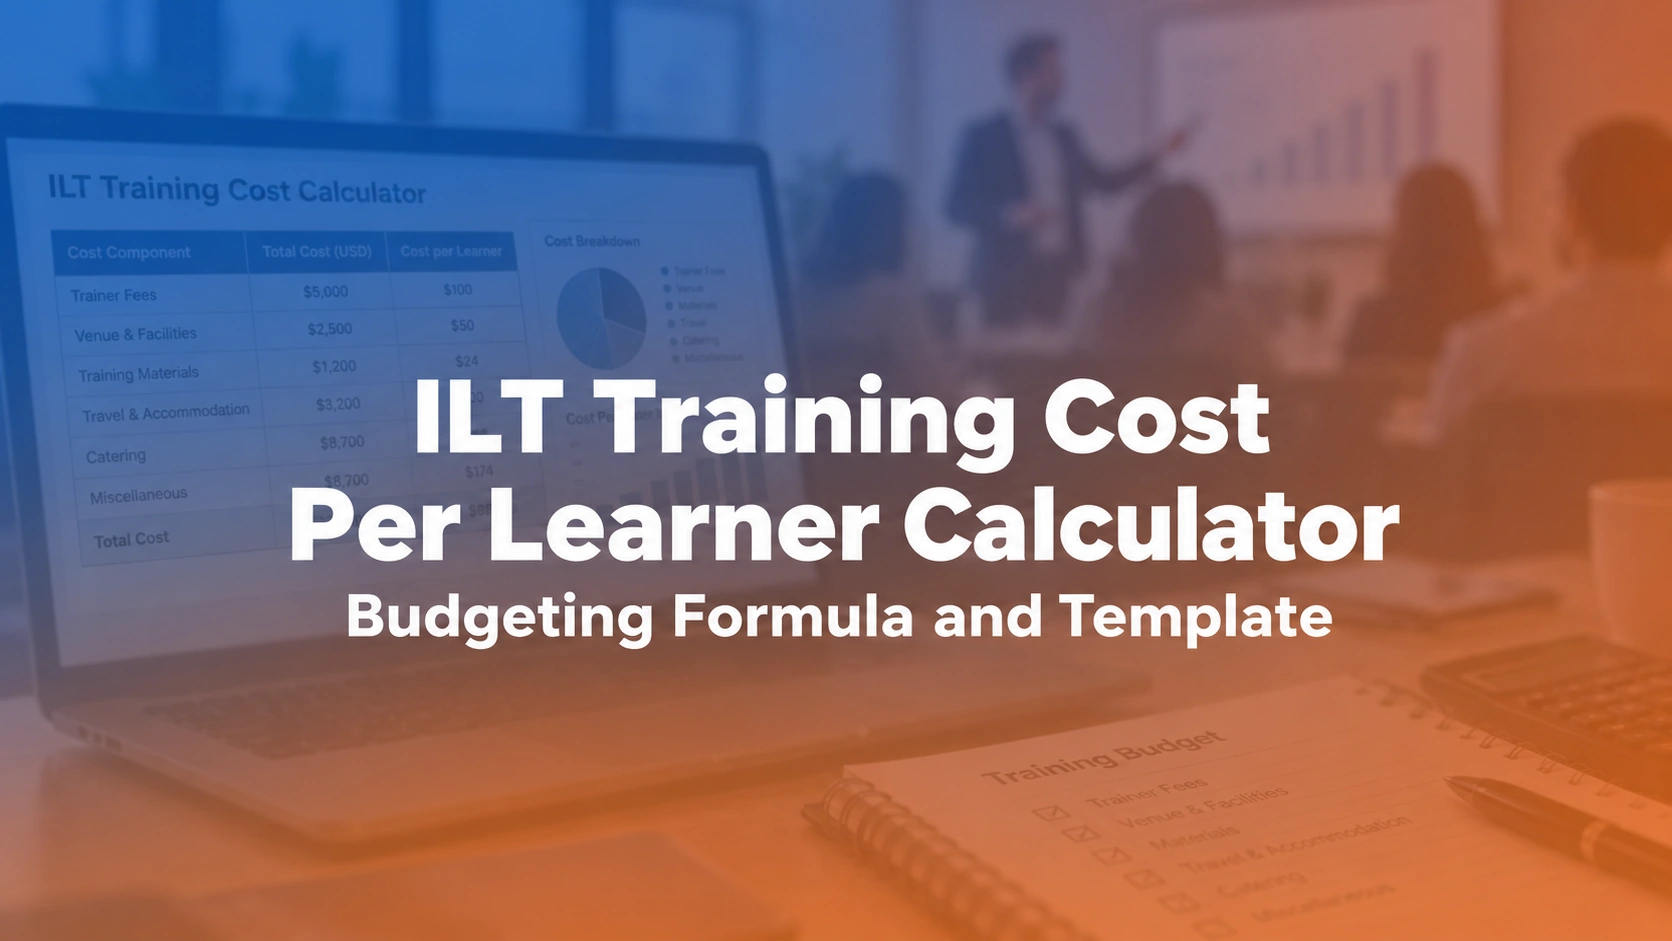
| Illustrative cost component | Budgeted amount (USD) | Measurement note |
|---|---|---|
| Instructor fees or allocated time | 1,200 | Direct session delivery |
| Venue and equipment | 450 | Room and technology |
| Travel and lodging | 300 | Only costs attributable to session |
| Materials and refreshments | 250 | Printing, supplies or consumables |
| Administration | 200 | Appropriate coordinator time |
| Total direct cost | 2,400 | Sum of listed categories |
| Cost for 24 attendees | 100 | Total divided by actual attendees |
What is the formula for ILT cost per learner?
A transparent starting formula is: ILT cost per learner = total attributable ILT session cost / number of actual participants. If you need a budget forecast, divide planned session costs by expected attendance and label the result as planned. For a completion-based measure, divide by learners meeting the defined completion criteria.
Worked example: A workshop that costs $2,400 and has 24 attendees costs $100 per attendee. If 30 seats were booked, dividing by 30 would report only $80 and hide the impact of six no-shows. These numbers are illustrative.
Related tools and workflows: training management system with training scheduler. Review how those steps affect the training budget and attendance records.
Which expenses should be included?
Consider trainer fees or allocated internal labor, design or preparation costs, room rental, meeting technology, travel, accommodations, materials, catering, assessment administration and coordinator hours. Distinguish recurring costs from one-time course development. Avoid counting a pre-existing enterprise license twice if finance already allocates it elsewhere.
Worked example: Two departments may disagree about whether employee time is part of training cost. Rather than bury the disagreement, show a 'direct delivery cost' view and a separate 'fully loaded cost' view with employee time identified.
For the connected process, see instructor management and instructor portal. Check that the numbers used in the calculation match the relevant operational records.
How should instructor labor be calculated?
For an external trainer, use the approved invoice and contractual expenses. For an internal instructor, use a documented hourly cost method that finance accepts and multiply it by delivery, preparation and reasonable follow-up hours. Separate internal cost allocations from cash paid to a vendor.
Worked example: An instructor paid a salary should not be treated as free merely because no new invoice arrives. At the same time, avoid claiming direct cash savings from reducing an internal allocation unless finance can confirm that the savings are realizable.
For related operational context, see training registration software and events and sessions. Preserve the source and date of each attendance or cost adjustment.
Why do no-shows change the real cost?
Many ILT expenses are fixed once a session is booked. A facilitator, venue and projector may cost the same whether 12 or 18 learners attend. Track scheduled capacity, registrations, actual attendance and completions separately. Use a denominator that reflects the business question rather than the most flattering rate.
Worked example: If the same $1,800 event has 18 attendees, the cost per attendee is $100; with 12, it is $150. That $50 difference suggests a scheduling or attendance problem, not necessarily an expensive trainer.
Compare these related workflows: training calendar together with ILT and VILT management. Validate what is supported before relying on it in a budget model.
When ILT training cost per learner spans multiple sessions, ask Trainery to demonstrate the exact approval, enrollment, instructor or reporting exception your team needs to manage.
How can L&D compare classroom and VILT costs?
Compare costs on an equivalent learning objective and cohort size. VILT may reduce room and travel expense but can add virtual platform, coordination and learner support costs. Classroom delivery may be necessary for equipment practice or supervised demonstrations, so a lower price alone cannot determine the mode.
Worked example: A virtual safety briefing and a hands-on machinery evaluation should not be treated as interchangeable offerings. Identify what competence must be demonstrated before comparing their delivery costs.
Related tools and workflows: training operations software with training task management. Review how those steps affect the training budget and attendance records.
How do you budget for repeat sessions?
Use separate assumptions for initial design, repeated delivery, capacity utilization and materials. Forecast the number of cohorts from expected participants and a reasonable effective class size, then allocate instructor and facility resources by date. Include a documented change buffer rather than hiding contingency inside an unexplained unit price.
Worked example: For 85 learners and a practical class limit of 20, at least five sessions may be needed. Budgeting for four because 85 divided by 20 is rounded down creates a capacity gap.
For the connected process, see live-training operations guide and ILT versus VILT comparison. Check that the numbers used in the calculation match the relevant operational records.
Which ROI calculations should remain separate?
Cost per attendee is an efficiency measure; it does not prove learning effectiveness or financial ROI. To estimate return, identify a measurable post-training business change and reasonably attribute a portion to training. Keep assumptions, time horizons and costs visible. An unvalidated productivity estimate is not evidence of realized savings.
Worked example: If training leads to fewer process errors, finance should validate the baseline and the value per avoided error. Count only the change supported by evidence; do not multiply a self-reported confidence score by salary and call it ROI.
For related operational context, see VILT delivery practices and training administration buyer's guide. Preserve the source and date of each attendance or cost adjustment.
What should a cost calculator report to decision-makers?
Display planned cost, actual cost, cost by category, seat utilization, cost per registrant, cost per attendee and cost per completer where completion is defined. Include a note explaining whether employee learning time and course development were included. That transparency makes comparisons across departments more useful.
Worked example: A program that costs more per learner may still be appropriate if it reaches a high-risk audience and verifies necessary skills. Use the report to explain the tradeoff, not simply rank courses cheapest to most expensive.
Compare these related workflows: training scheduling software comparison together with training management system comparison. Validate what is supported before relying on it in a budget model.
How to use the ILT cost calculator workbook
Download the Excel workbook above and begin with one completed or planned ILT session. Use a consistent currency and record each cost once. The spreadsheet is a planning aid, not a substitute for finance-approved allocations or a validated attendance record.
- Define the session: enter the session ID, date, delivery mode, seat capacity, and expected registrations.
- Add direct costs: enter facilitator fees or allocated instructor time, venue, travel, materials and coordinator costs using the same scope for every session.
- Separate one-time costs: identify course development or setup costs, and document any allocation across repeat cohorts.
- Set denominators: keep registered, attended and completed learner counts in distinct fields; never divide by a zero count.
- Compare planned and actual: calculate budgeted cost per expected attendee, then actual cost per attendee and, where useful, cost per qualified completer.
- Review exceptions: note cancellations, no-shows, changed invoices, travel overruns and the owner approving adjustments.
What should you ask a training management system vendor?
Bring an anonymized session budget into the demo and ask the vendor to show which records supply expected attendance, actual attendance and instructor assignments. Change the attendee count after a no-show and ask how a revised cost-per-attendee report would be produced. Also ask whether the workflow can distinguish forecast from actual spending, track session-level expenses and export inputs for finance reconciliation. Verify these specific capabilities in the configuration offered rather than assuming every training platform includes them. Compare the training management systems guide and TraineryTMS overview before selecting a demo scenario.
Worked budget scenario: compare two attendance outcomes
Suppose a team books a 24-seat classroom session at a projected direct cost of $2,400. The initial budget shows $100 per expected attendee. On delivery day only 18 learners arrive, while the instructor, room and most material costs remain unchanged. Actual cost per attendee rises to about $133.33, even though the approved session budget did not increase. A second session costing $2,700 with 27 attendees also costs $100 per attendee. That comparison is useful only if the sessions cover equivalent objectives, participant eligibility and the same cost categories. If a course requires a hands-on assessment, compare the cost per qualified completer as an additional measure rather than labeling the cheapest delivery as the best. In the worksheet, keep expected attendance, actual attendance and confirmed completions in distinct cells. Use formulas that return a blank or a clear warning when the denominator is zero. This prevents a division error from becoming an apparent financial result in executive reporting.
Conclusion: calculate the cost of delivered learning
Calculate ILT cost per learner by dividing the attributable cost of a session by the learner count that matches your question. Use expected attendance for planning and actual attendees or qualified completers for post-delivery reporting. Compare like-for-like cost categories, keep no-shows visible and avoid treating lower cost as proof of stronger learning outcomes. Start with the Excel workbook, then use a realistic scheduling and cost-reporting scenario when evaluating TraineryTMS.
Explore how TraineryTMS supports instructor-led training scheduling, session administration and related learner records. Bring a difficult real-world scenario to the demonstration.
Book a DemoDownload your workbook
Enter your name and work email to unlock the Excel file.